Crime, Police, and the Megaoperação Contenção in Rio de Janeiro
1. Context
On October 28, 2025, approximately 2,500 officers from the Civil and Military Police of Rio de Janeiro entered the Complexo do Alemão and Complexo da Penha, a favela complex in the north zone of Rio de Janeiro, in what became known as the Megaoperação Contenção. The official objective was to contain the territorial expansion of Comando Vermelho (CV, one of the biggest criminal organizations in the country) and to execute some 100 arrest warrants and 180 search and seizure warrants. By the end of the operation, over 130 people had been killed and 100 arrests, as well as 118 weapons seized, making it the deadliest police operation in the history of the state of Rio de Janeiro.
After the operation, the debate regarding the efficacy of police force as a mean to fight organized crime and ensure public safety in contested zones gained a lot of the highlights. Some defend that the police is ineffective and the killings are a proof of the lack of preparadness from the police. Others state that this action will discourage individuals to join factions due to the risk it poses to their life. Other arguments are presented from both sides, heating the dabate. The problem with the discussion is that it is mostly based on the recall of case studies, narratives, sequence of "logical" connections and sometimes data that show or not correlations favoured to an argument. As I see it, this creates a fundamental problem of communication between both sides of the discussion, specially when the topic quickly becomes polarized and defending or critizing the operation becomes a signal to being a "leftist" or "rightist".
This post aims to a first attempt at studying the relationship between police enforcement and violent crime in this contested territory using longitudinal data and a simple dynamical systems model to lay down a formalization of some hypothesis raised by the arguments in the discussion. The goal is not to produce a definitive causal analysis (that would require a more careful identification strategy and a richer model) but to establish some basic empirical patterns and to test whether a few assumptions that supposedly dominate this relationship are enough to explain the observed data. This is exploratory and preliminary work; a more rigorous version of the analysis is under development.
2. Data
Fogo Cruzado
The first data source is the Instituto Fogo Cruzado, which records georeferenced shooting incidents across the metropolitan region of Rio de Janeiro, derived from Disque Denúncia tip data. Each occurrence is classified as involving victims (dead or wounded) or not, with further breakdowns by civilian/police status, age category, and whether the incident took place during a police action. I use data covering 2022 - 2025 for a spatial analysis of the rate of victimsm from shootings accross the city of Rio de Janeiro. I choose to start from 2022 to eliminate anomalous effects during the COVID-19 pandemic. The results will thus show the annual average, based on these 4 recent years (2022, 2023, 2024 and 2025). A note worth mentioning is that victim counts aggregate civilians, police officers, children, teenagers, and the elderly across dead and wounded categories.
Disque Denúncia is a initiative operated by Public Security Secretariats across Brazil, it ensures anonymity of callers, without tracking IP, phone numbers or any personal data. The data is filtered to eliminate false accusations and to direct emergency registers to the police. Disque Denúncia receives registers of missing people, violence against women, fraud, tips on wanted criminals and shooting incidents, the last one is the one I'll be using to build one of the analysis on violence in Rio de Janeiro. I will discuss the limitations of the data sources once we get to the mathematical model.
ISP-RJ
For the time series analysis I use the monthly historical series from the Instituto de Segurança Pública do Rio de Janeiro (ISP-RJ), which reports crime statistics disaggregated by delegacia (CISP) and integrated security area (AISP) from January 2003 onward. The primary outcome variable is Crimes Violentos Letais Intencionais (CVLI), encompassing intentional homicide, robbery followed by death, and grievous bodily harm resulting in death. I am interested here in violent crimes, which I assume is what individuals fear the most (at least I fear more losing my life than my phone). The enforcement intensity variable, which I call police actions (AMP), represents not passive police presence on the streets, but incursion events that leads policemen to enter favelas and frequently engage in gunfire with local gangs. This is importat to state here because this means that the entire model developed here is not capable of of taking into account police presence, only actions registered on the system. Police action is then defined as the sum of monthly drug search-and-seizure warrants (cmp) and arrest warrant executions (cmba).
If the reader of this text is a Portuguese speaker, I highly recommend listenning to the podcast A República das Milícias. On it, you will see that a considerable fraction of police incursions on favelas do not go registered. This may be one of the largest limitations of our dataset and will be better addressed in the discussion of the mathematical model. Finally, population estimates for each AISP are constructed from IBGE Census data (2000, 2010, 2022) for neighborhoods that are included in each AISP and years between census had their population estimated via a linear interpolation. Per-capita rates are expressed per 100,000 inhabitants per year unless noted.
3. Spatial Analysis of Shooting Incidents
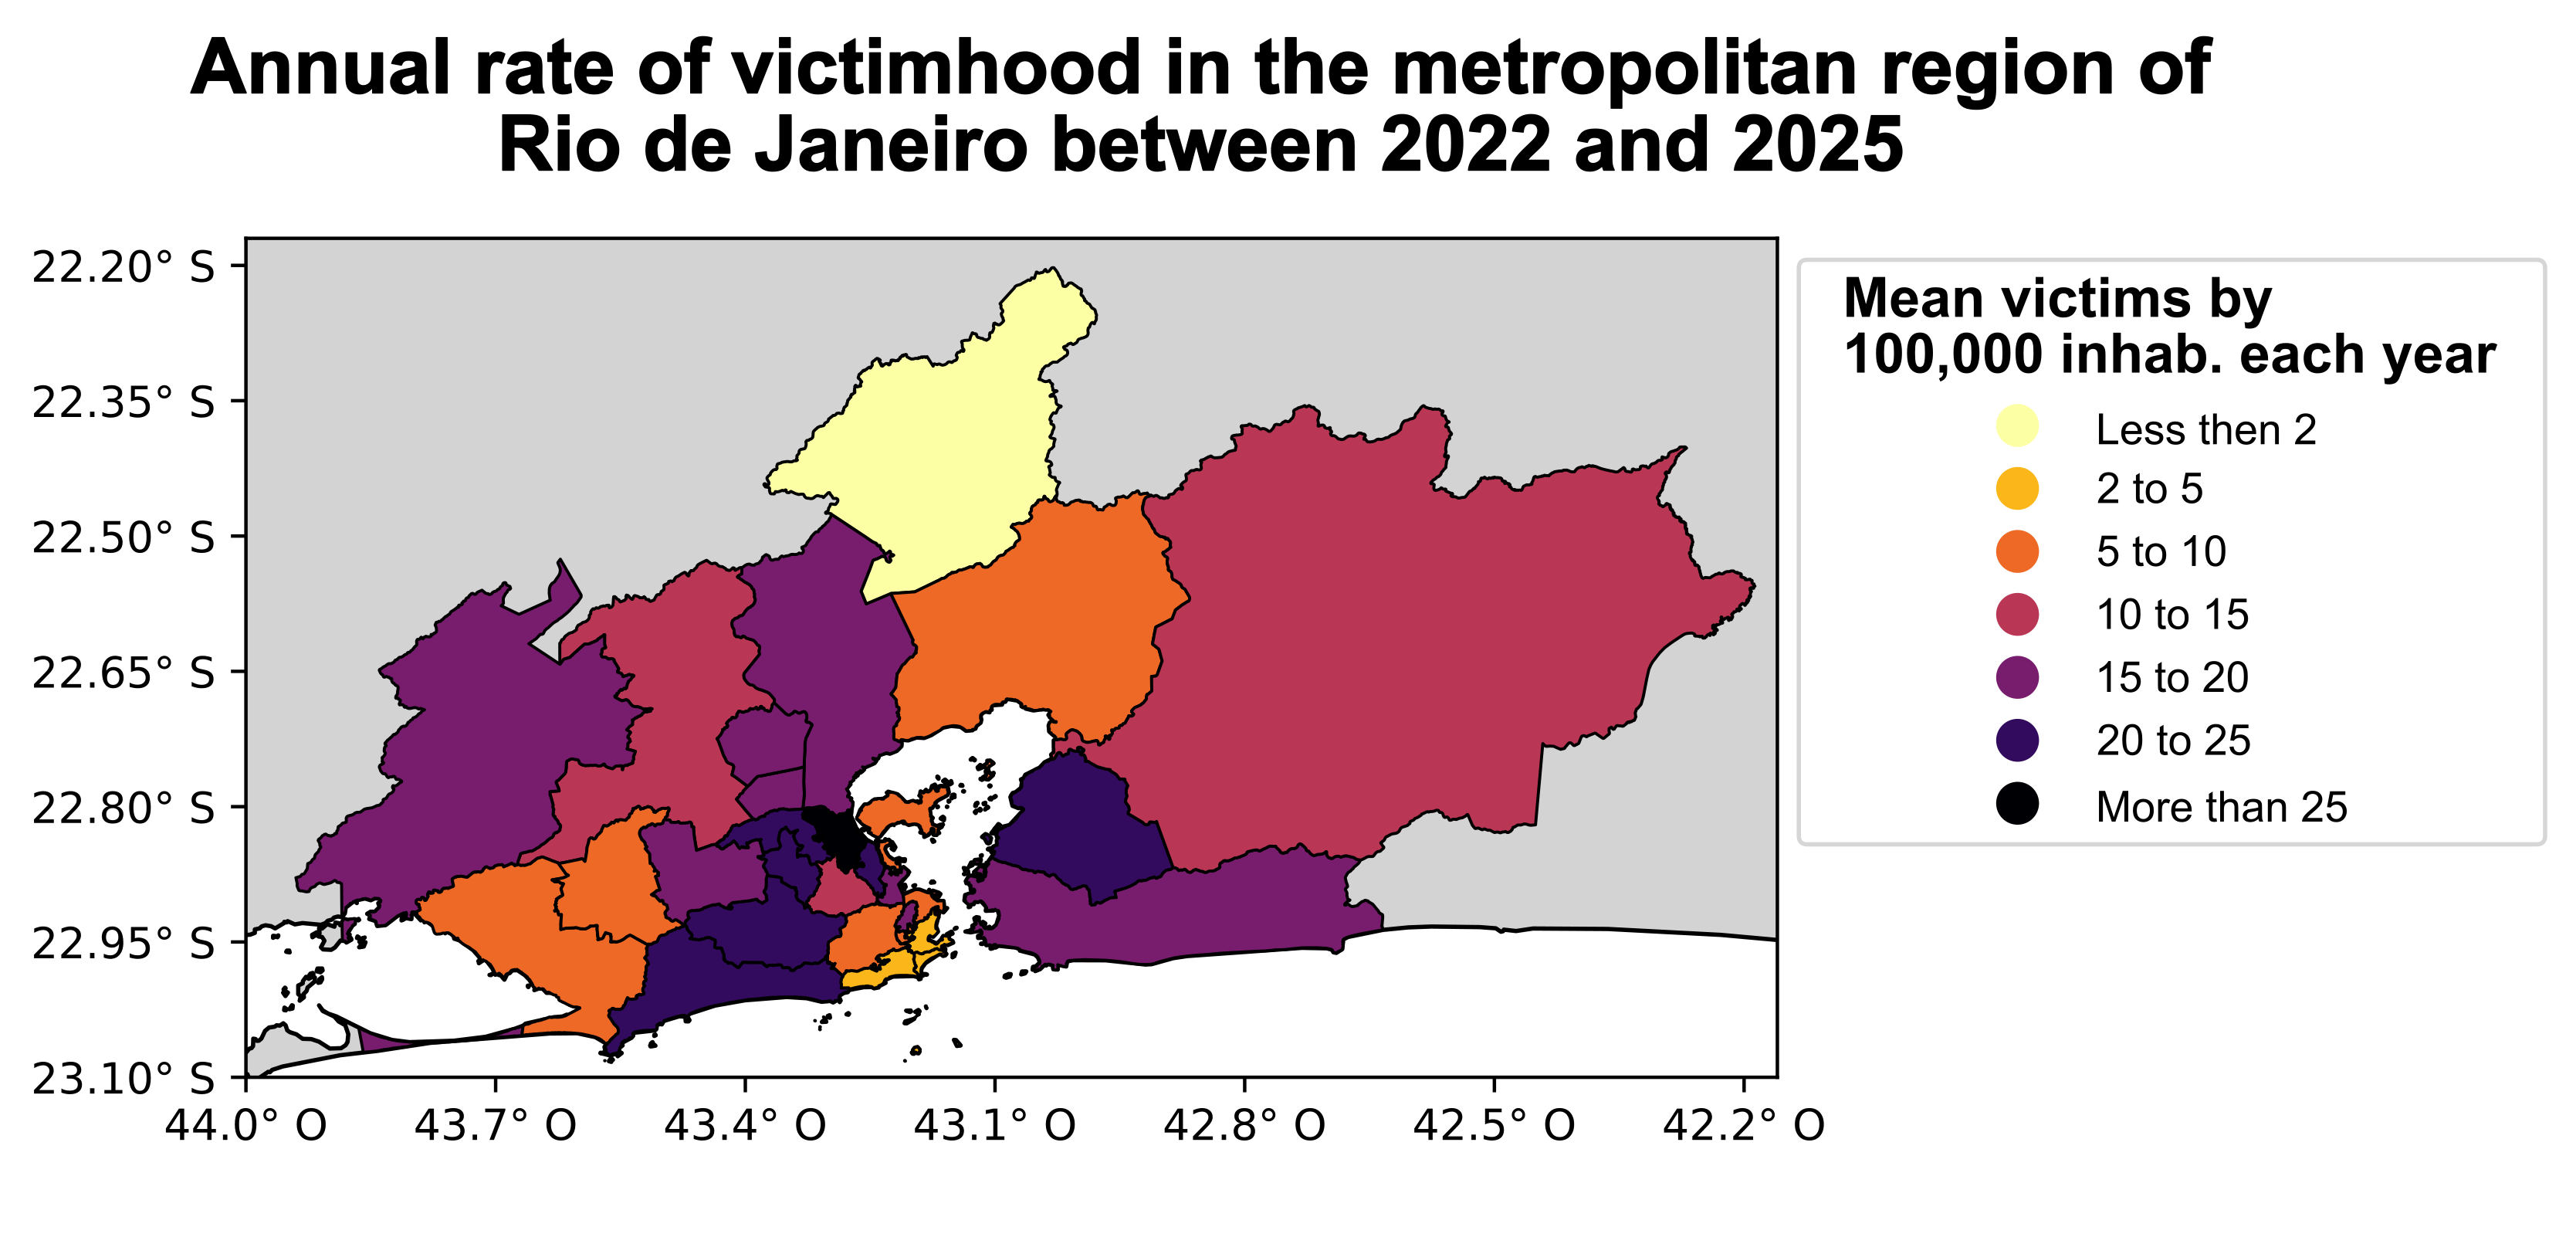
For each AISP in the metropolitan sample, I count the annual average number of victim-involving occurrences and total victims (dead plus wounded) over 2022-2025, then normalize by AISP population from the 2022 Census.
Favelas vs. non-favelas within the same AISPs
In order to see how the reality inside and outside favelas differ. I use the IBGE 2022 Census shapefile of Favelas e Comunidades Urbanas (FCU) to classify each Fogo Cruzado occurrence as falling inside or outside favela boundaries. Given a favela contour, any occurrence that falls inside or 100 meters close to the edge of the boundary is considered to be inside the favela. This 100 meters buffer account for geolocation error and crimes that happen at the vicinity of FCUs.
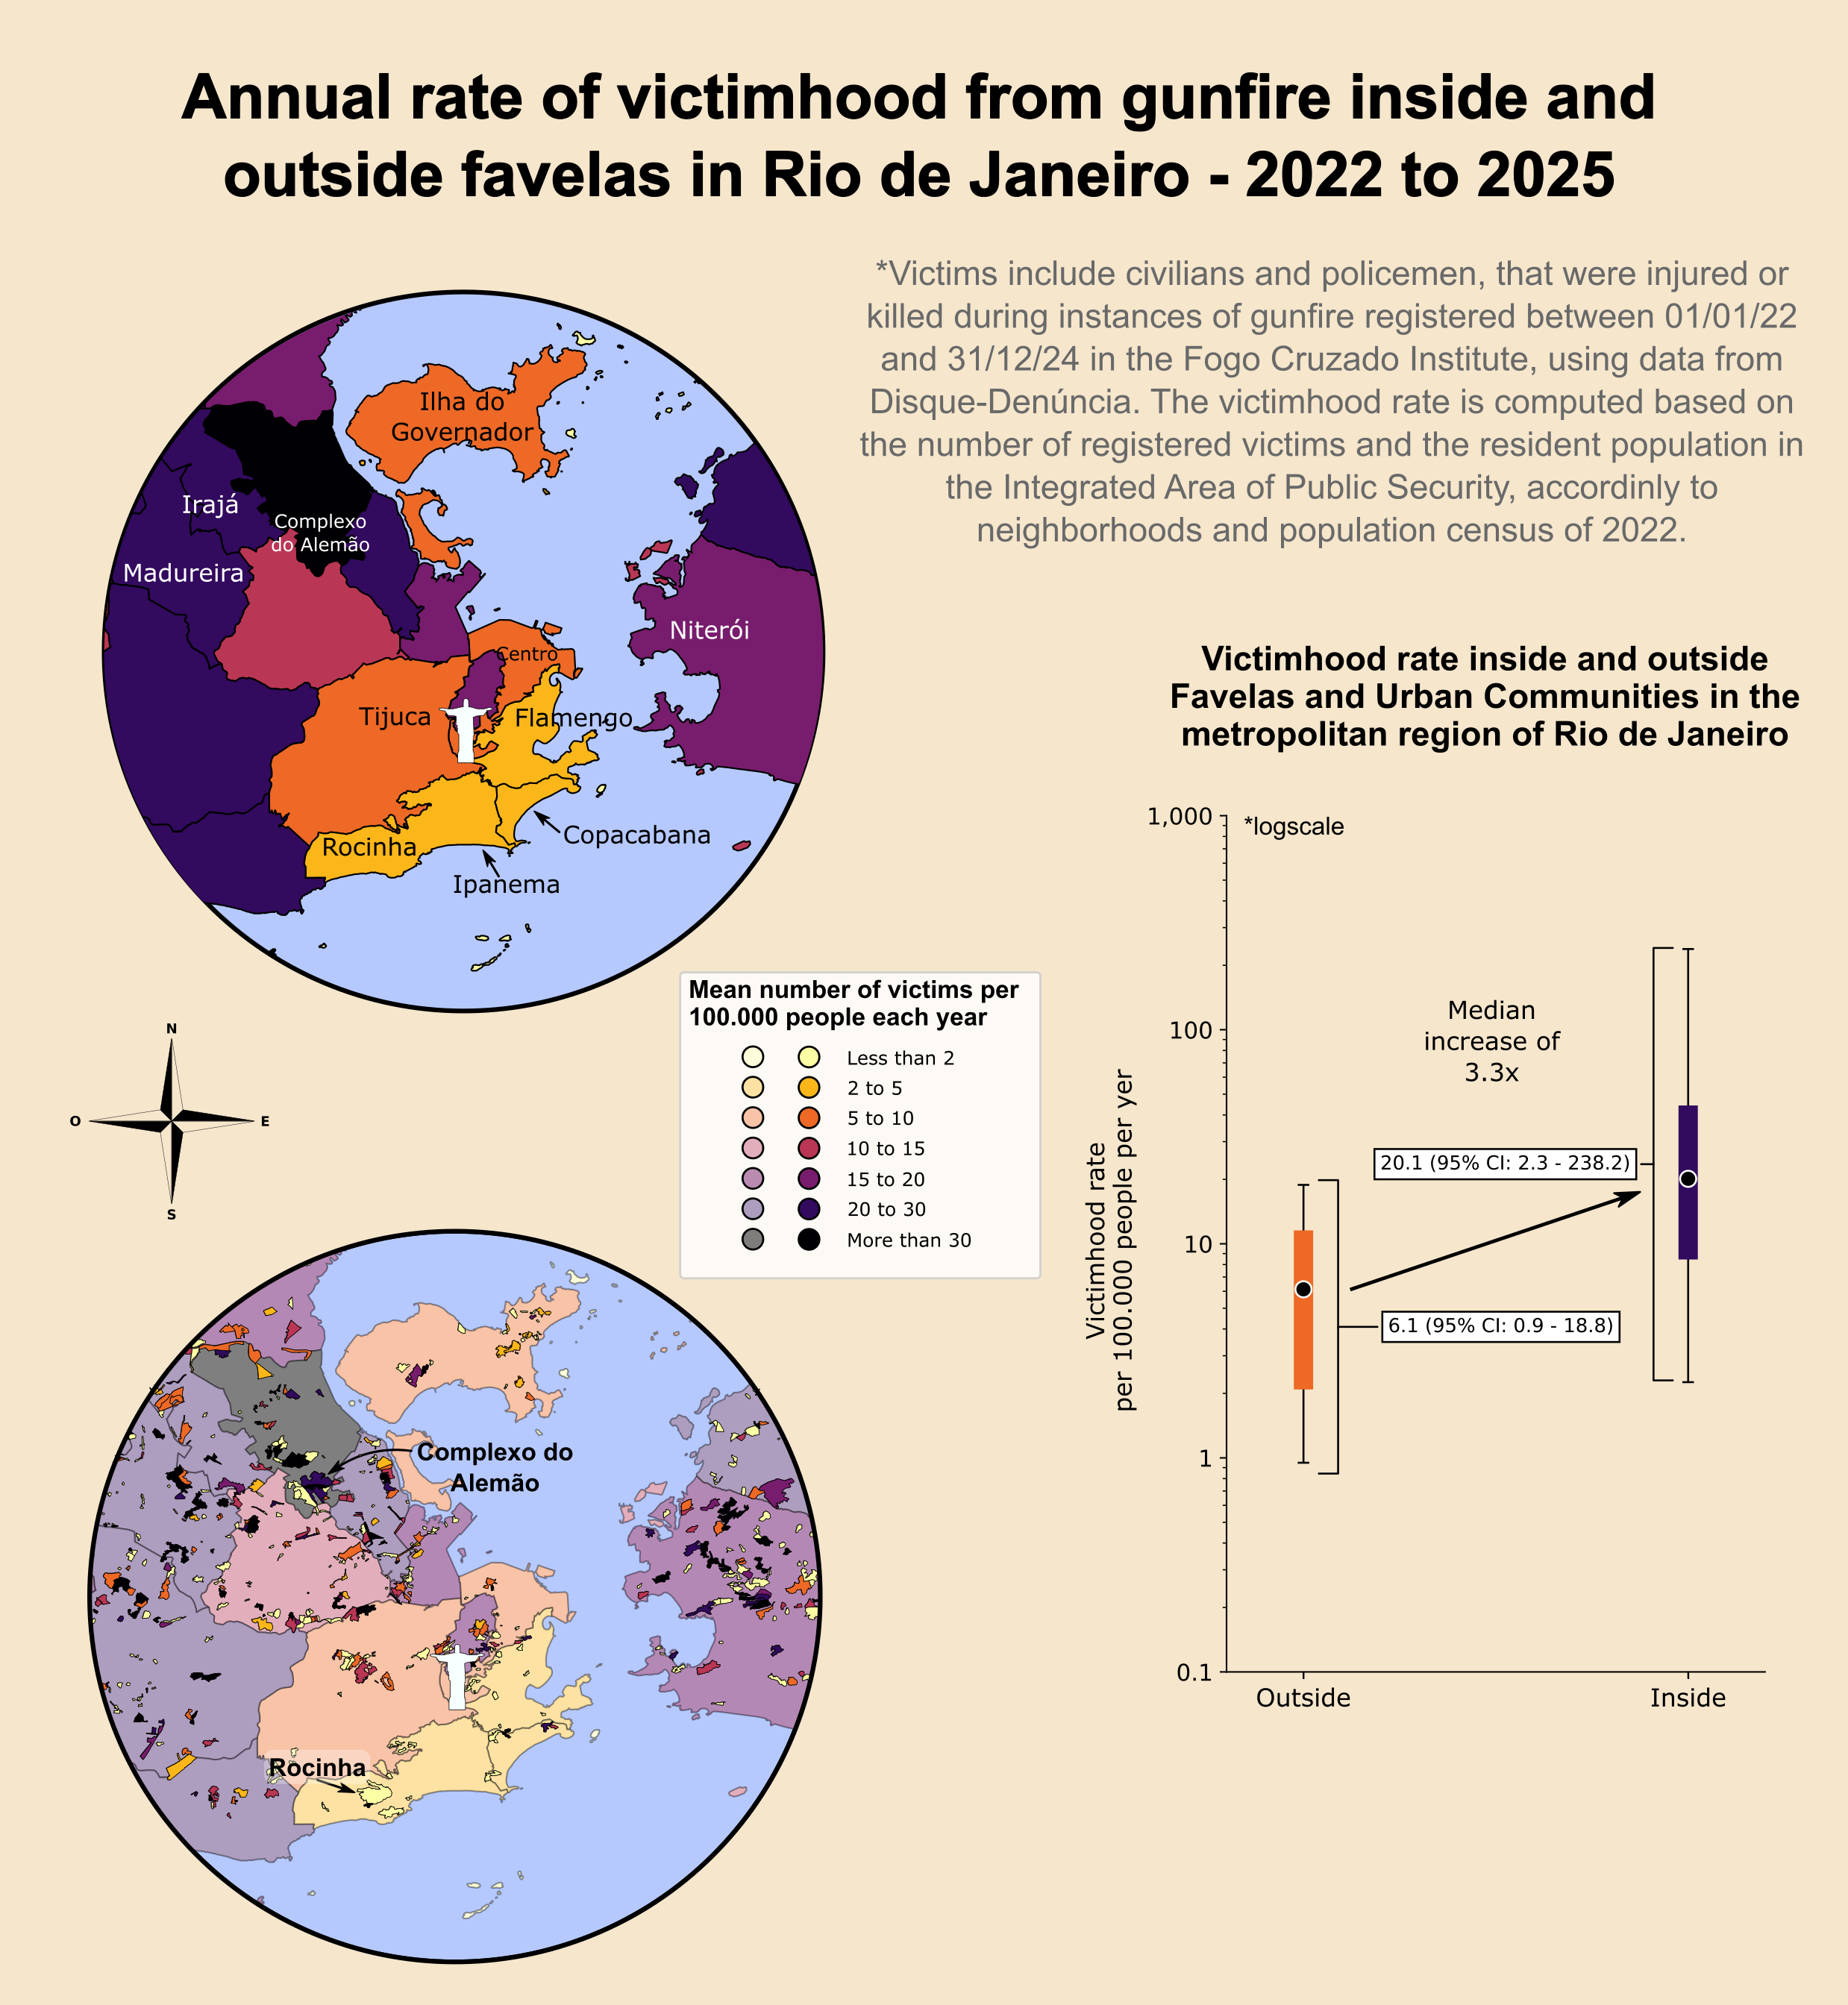
As we see, FCUs have a median victimhood rate of 20.1 per 100,000 people each year, while zones outside FCUs have a median victimhood rate of 6.1, 3.3x lower. However, what strikes me as most worrying is that the upper limit of the 95% confidence interval of victimhood rates outside FCUs in AISPs accross the metropolitan region of Rio de Janeiro is 18.8, below the median of FCUs. That means that even the most dangerous zones (in terms of violent crimes) outside FCUs are still safer then the median favela. The range of variation in favelas victimhood rate is also astonishing, the log scale hides it visually, but we have favelas ranging from less than 2 deaths by CVLI per 100,000 people each year (lower than the touristic south zone of Rio de Janeiro) to favelas with a rate near 238, more than 100x bigger. Although not directly comparable due to definition issues, New York city had a homocide rate of 4.3 per 100,000 people in 2024. In a more direct comparison, Brasília, the capital of Brazil, had 267 deaths by CVLIs in 2025 according to the Secretaria de Segurança Pública do Distrito Federal (SSP-DF), yielding a CVLI rate of 9 per 100,000 people.
With this data and maps at hand, we may reach very different conclusions depending on the narrative we choose or how we employ our statistics. From now on, I will focus on the debate on the relationship between police incursions at favelas and criminal activity. Individuals favorable to the idea that more police action in favelas is necessary to decrease crime, specially violent crime, usually mention that criminal organizations reign over favelas on a regime of terror and many children who are raised on these violent places see that as promising oportunities to make money. Police needs to act firmly to discourage future individuals to join criminal organizations and allow governmental agents to enter these regions to properly bring schooling, sports, infrastructure and all. Of course, this is not a rigid view and a lot of different versions of this narrative are found.
On the other side, individuals who are against it lean on the logic that a violent police will not be seen as a savior from criminals, but maybe as worse than criminals. Usually these individuals advocate for alternative methods of discouraging future individuals to join organized crime. Both sides in the end have the same goal: violent criminal organizations will be self-sustained as long as individuals decide to join them, we thus need to discourage children to join and criminals to continue on their path. The difference is how each side sees this being done.
4. Time Series: CVLI and Police Actions in AISP 16
Let us now investigate two different ways of looking at the data on crime and police in Rio de Janeiro, according to the ISP-RJ. Before deploying a model, let us see how the standard inspection through correlations using the same dataset fuels both arguments on the efficacy of police actions against criminal organizations. Again, I'll use data on deaths by Intentional Violent Lethal Crimes (CVLI), however I will now restrict the data to the North and West zones of the capital city of Rio de Janeiro. For police action, I will count the sum of executions of warrants of search and seizure, and arrest warrants. In the data we still have arrest reports, policemen killed in service and deaths by police action. For now, I'll leave these out, since deaths by police action and officers killed in service are more related to the intensity of these actions then to their frequency. Arrest reports are unclear to the type of action that lead to the arrest. For instance, an arrest may occur when police is on active patrol and spots a crime (which I'm calling here police presence) or when police is called to an occurrence and catches the suspect, leading to an arrest (which I would include in police action). Thus, arrest reports take into account both police presence and police action. Because of this, they will not enter the count for police action.
When plotting the raw numbers against each other, we are struck with a clear signal of a correlation between higher police actions and lower deaths by CVLI.
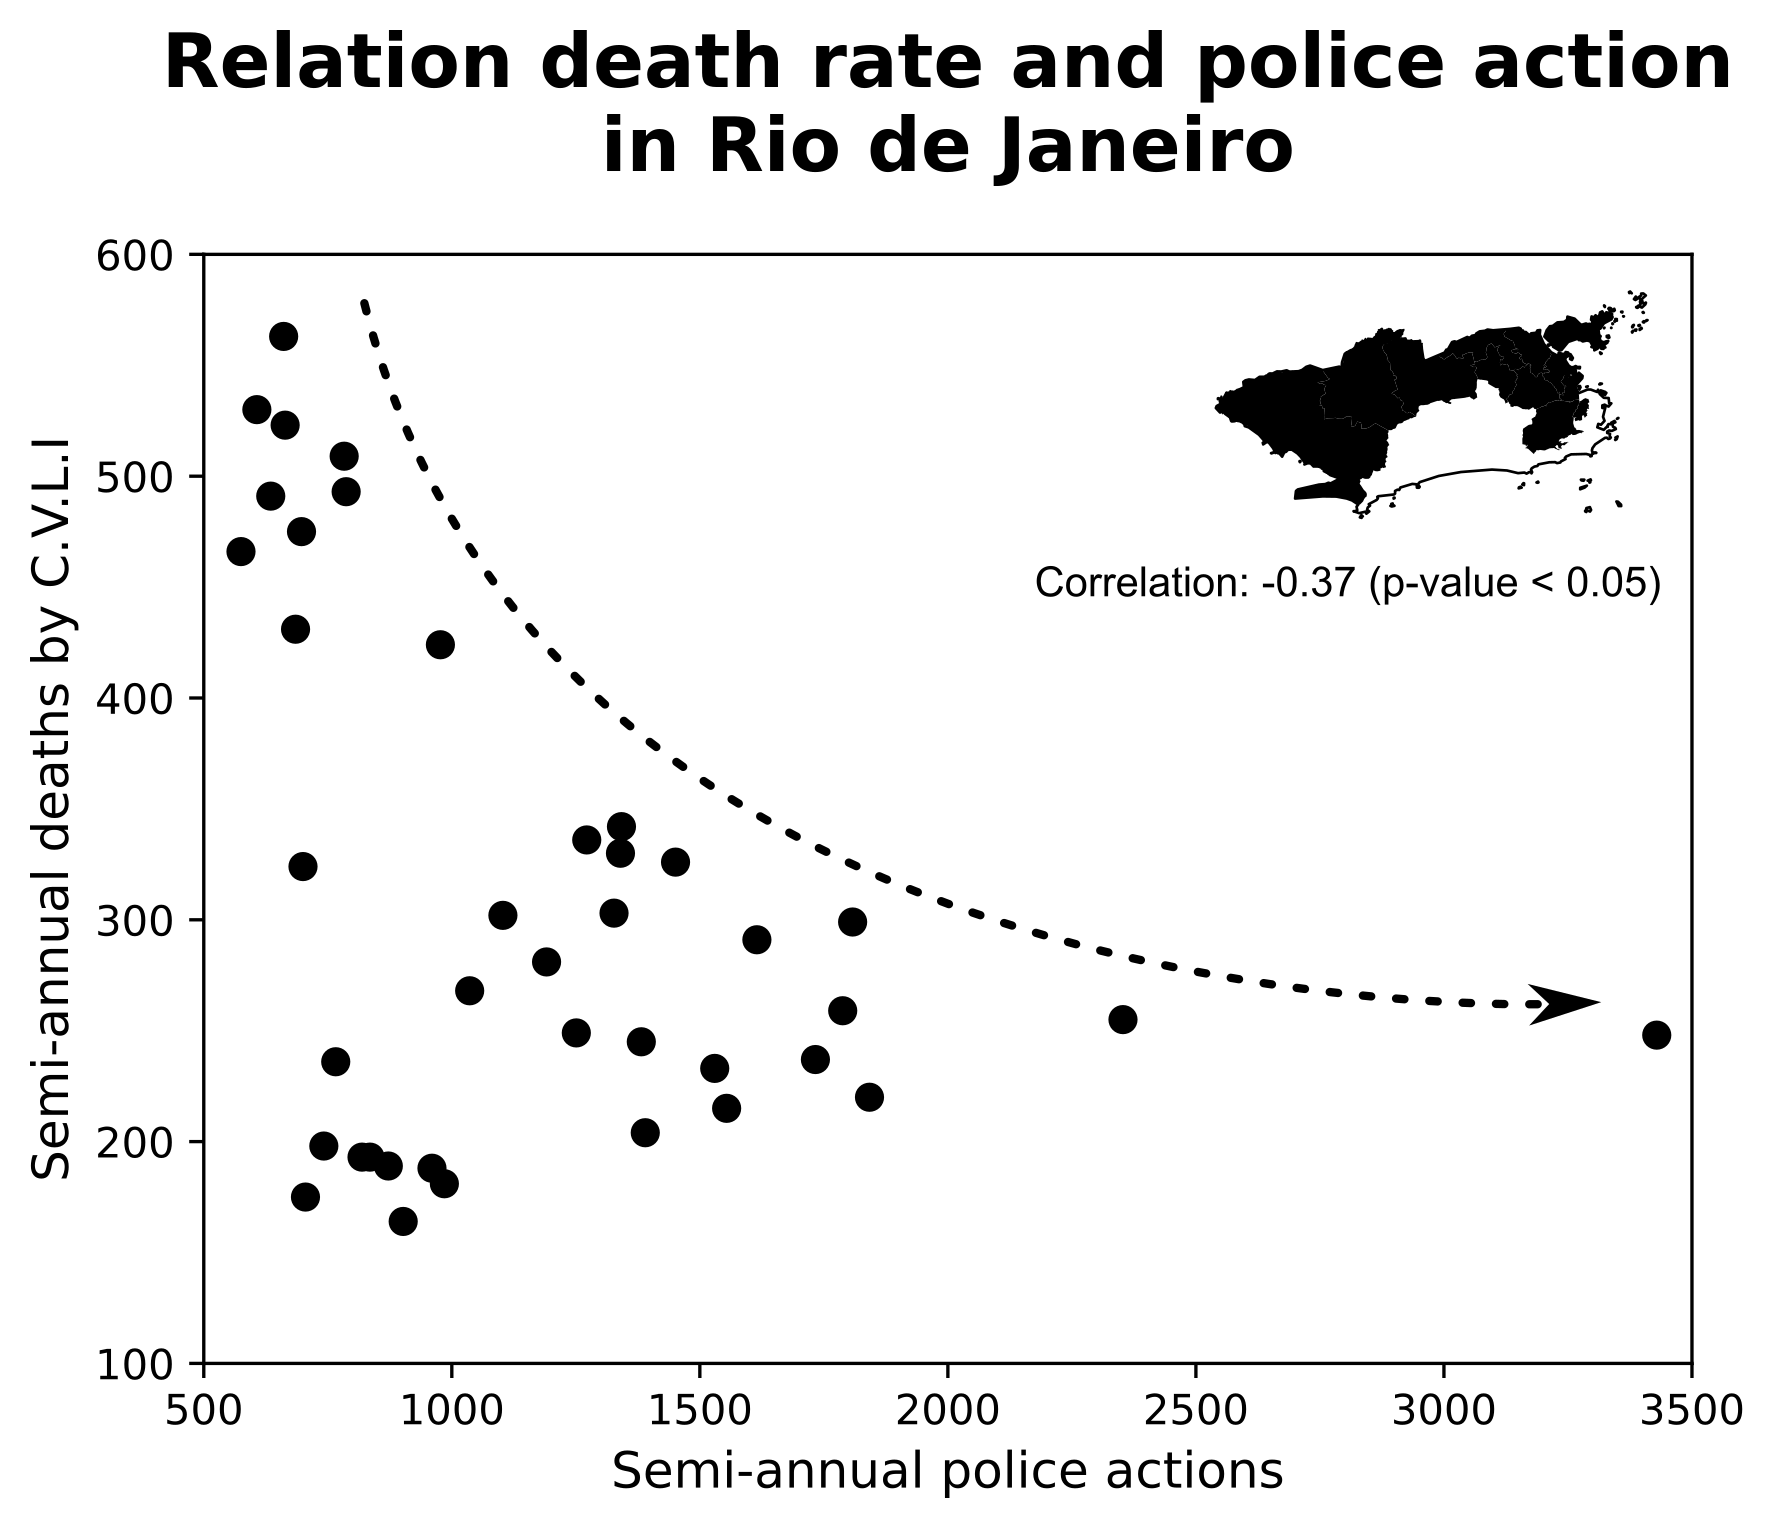
At a first sight, this result plays in favor of the idea that more police action fighting crime is needed to bring peace to favelas in Rio de Janeiro. But not so fast... The issue with this data is that first of all, it is just a correlation. We cannot know if police action is indeed causing deaths by CVLI to decrease or if both have an intermediate phenomenon at play. Another issue here is that, since crime is local and criminal organizations in Rio de Janeiro change considerably between North and West zones, aggregating both of them mix two different regimes. For example, while de North zone is much more controlled by Comando Vermelho (where the Megaoperação Contenção happened), the West zone is more controlled by milicias, as shown in the Mapa dos Grupos Armados (Armed Groups Map) of Rio de Janeiro. The final issue I see is that both variables are essentially a time series. We should them look at them temporaly, not just on a scatter plot.
So let's do exactly this. Let's separate North and West zones, look at the data across years and instead of computing the raw numbers of CVLI, I'm going to use the rate per 100,000 people, to account for population growth from 2006 to 2025.
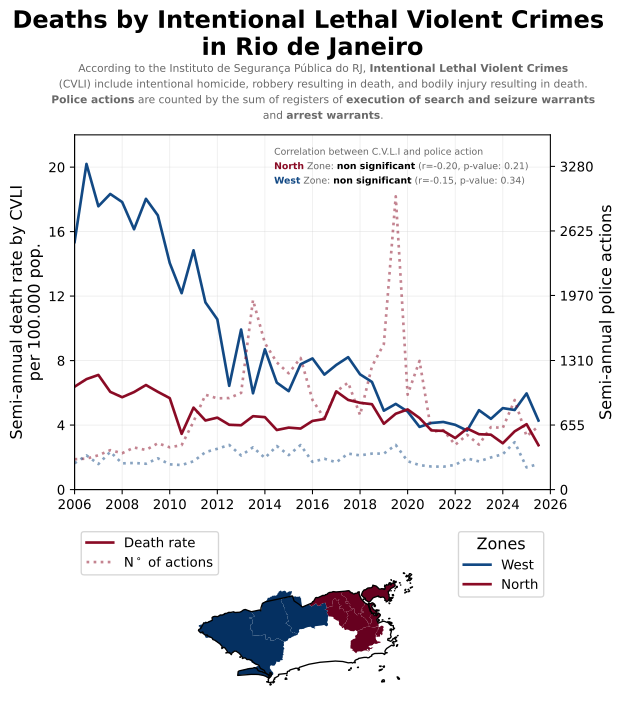
We now don't have a significant correlation between violent crime and police action on either zone of the city. The data is now in favor of the argument that police action may not be an effective way to promote safety for the population. Again, remember here that when one defend this argument, it does not mean that the police is useless, it means that invading a contested area with agents to fight criminals is not leading to decreases in violent crimes.
However, the defender of the first argument, in favor of police actions, could easily point that even with these new data. The argument against police incursions is not consistent with the data because we do not know if police incursions are happening where favelas are, the data is not showing this. Maybe, the lack of correlation is due to the fact that some police actions are not happening inside favelas or close to favelas, causing noise to the data and hidding a true correlation. This is a valid argument and we must try to investigate it. As I mentioned in the beginning of this text, Megaoperação Contenção in 2025, and Operação Arcanjo in 2010, both happened in the favela complex of Complexo do Alemão and Complexo da Penha. Since this region concentrated the biggest police operations in history and both are inside AISP 16, the area with the highest annual death rate by CVLI of Rio de Janeiro, let's focus now our analysis to AISP 16. To reduce monthly noise, I fit a Generalized Additive Model (GAM) with a single spline term to each series to capture long term patterns in rise and fall of violent crime and police actions.
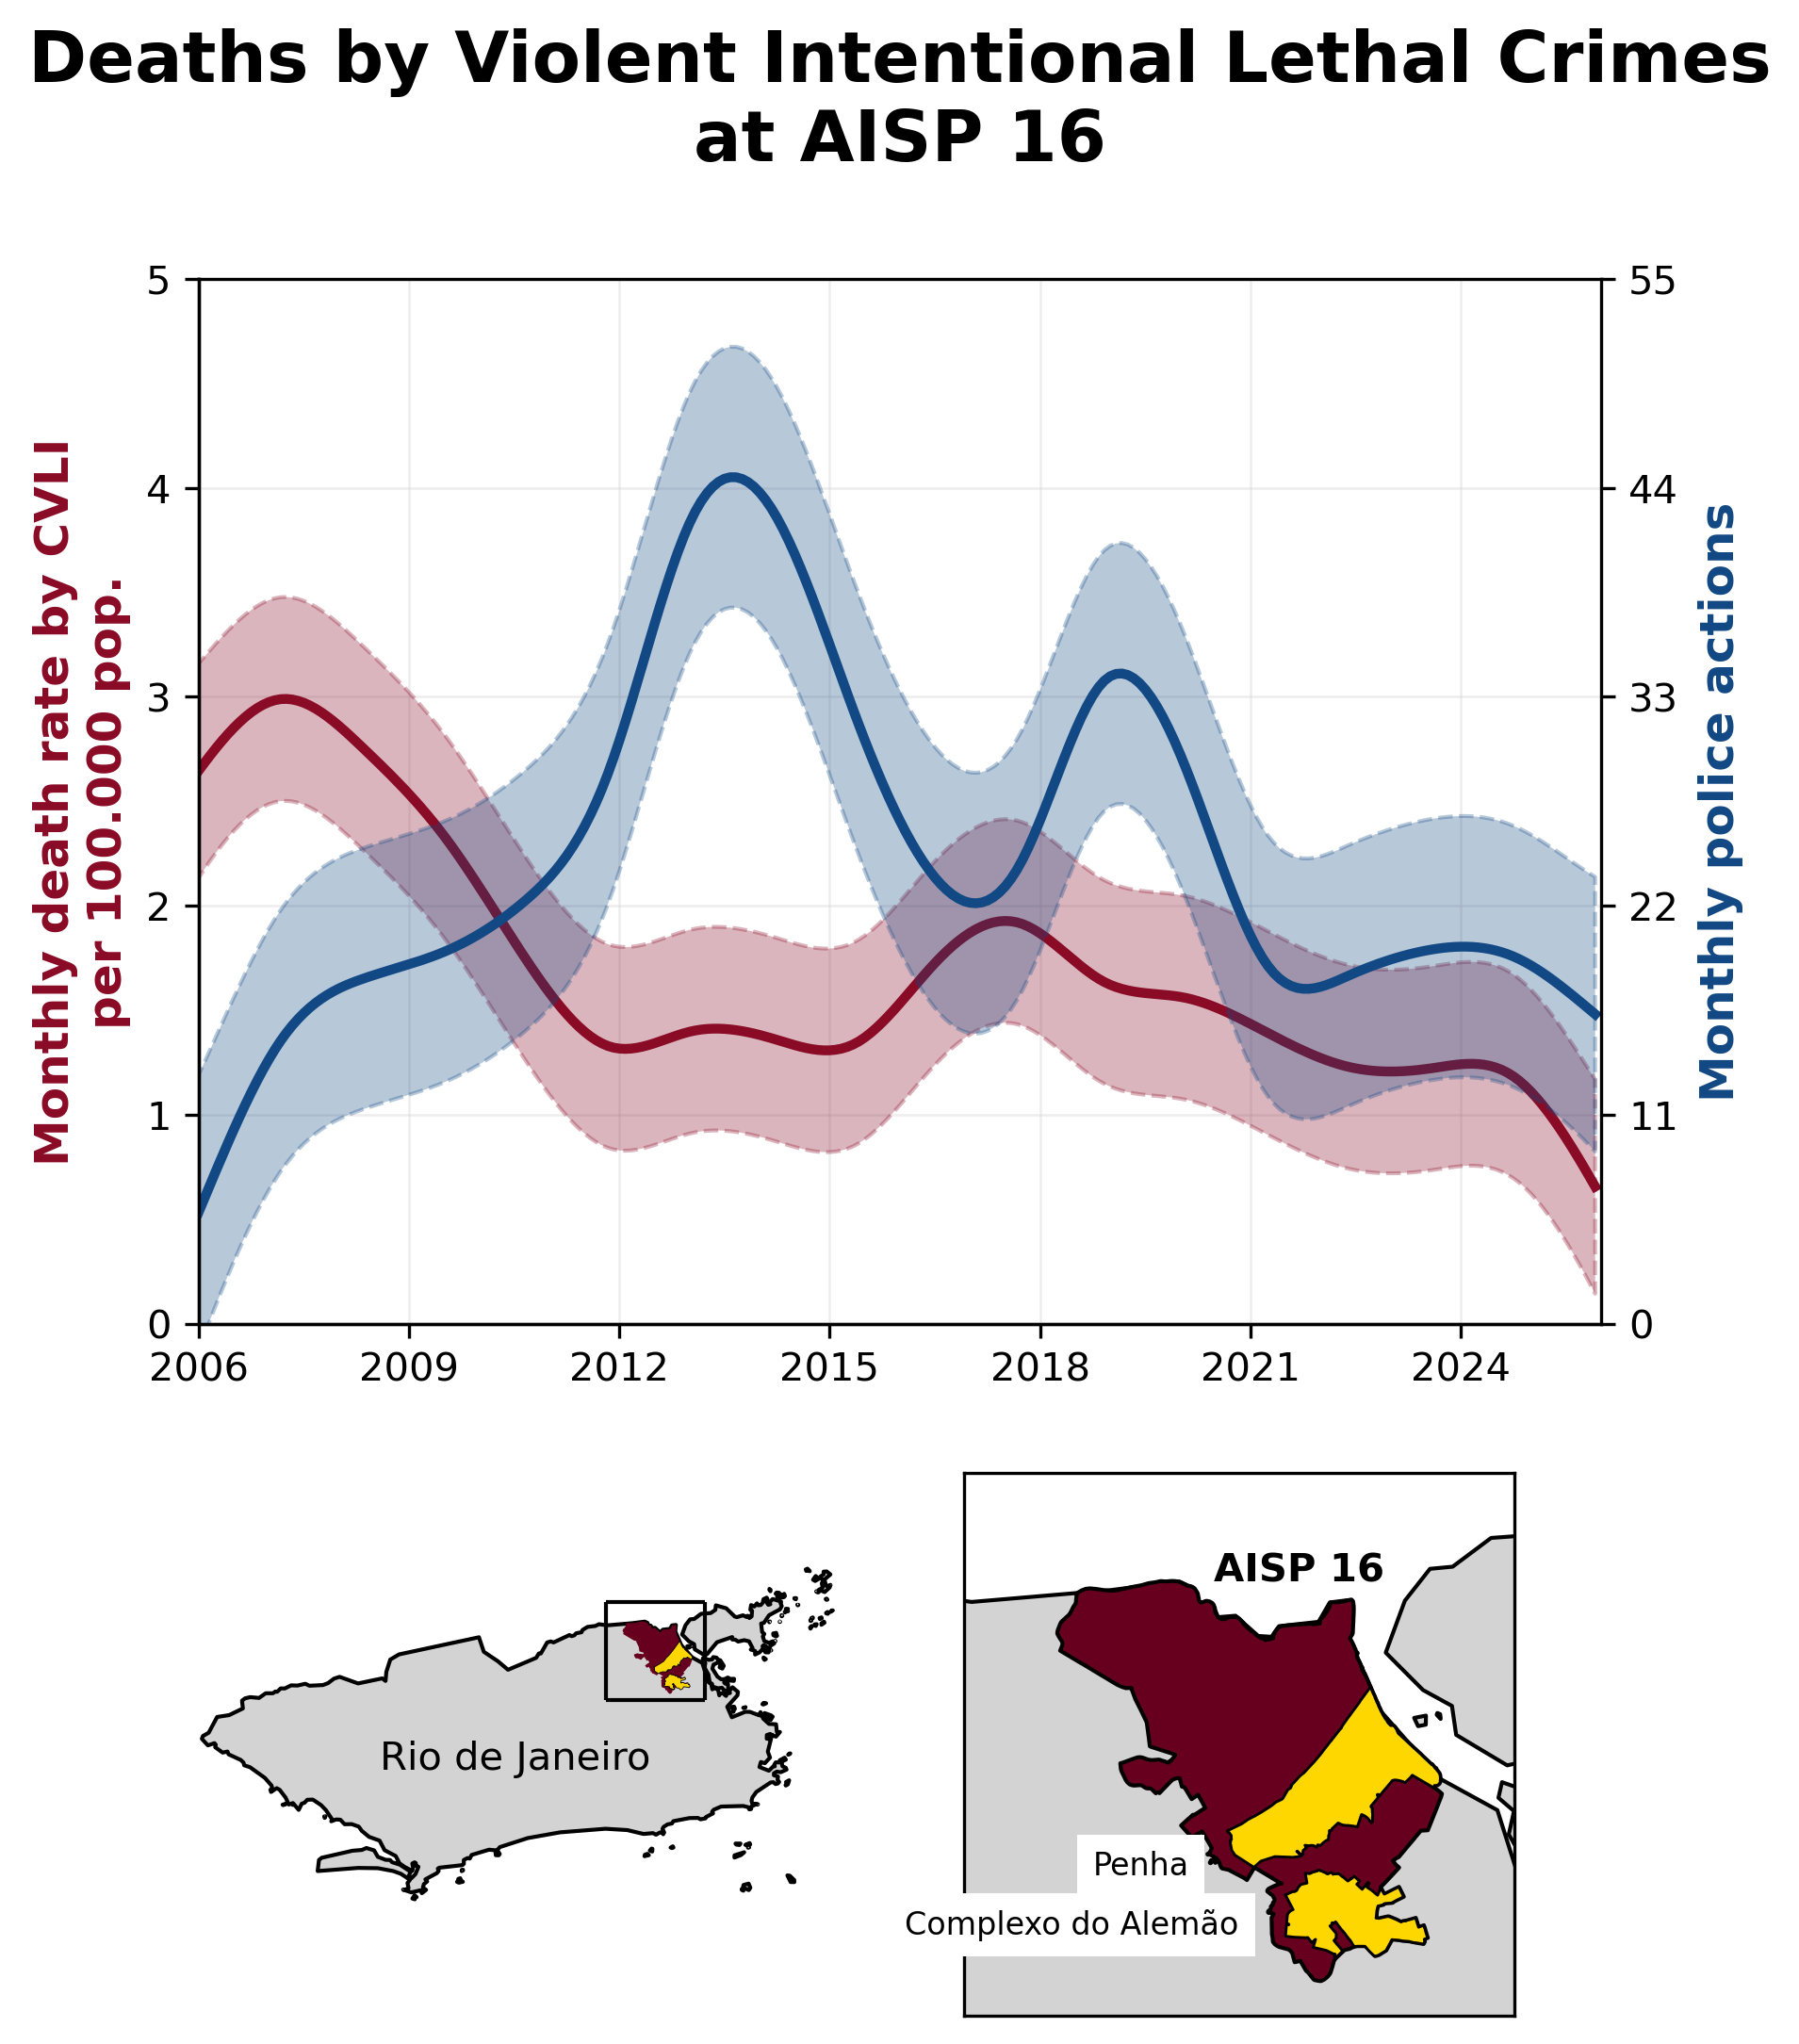
The CVLI death rate tendency fell sharply from 2007-2012 and remained low through roughly 2012-2015, then rose steadily until around 2017, decreasing back between 2018 to 2024, followed by a sharper decrease is 2025. The Pearson correlation between the monthly smoothed series is statistically significant ($r \approx -0.17$, $p < 0.01$). We are again back at a favorable result towards the police intervention argument.
We could continue on and on, building arguments that should lead to analysis of the same data from a different angle. This is why I don't think that simply looking at data with statistics is enough to test arguments and hypothesis. We need to bring our arguments to the realm of mathematics, where they can be formalized and used to generate expected behaviors, given our thoughts about the issue, that can be then compared to the data.
5. A Simple Dynamical Model
Basic formulation
In order to start writting down the model for what we should expect between police actions and violent crimes, let us start by thinking what should happen with crime in the absense of police, and what should happen with police in the absense of crime. Beginning by crime with no police. A reasonable thought I have is that without any law enforcement, criminal activity would rise, but not forever, eventually crime would saturate at some level. In cooperation games, the lack of some form of vigilance increases the number of players choosing to be selfish and not cooperate (see references [1] and [2] at the reference sections). Crime is then considered to be a self-replicating activity (due to recruting of civilians or incentives others feel to engange in ilegal activities). Writting $H(t)$ as the monthly violent death rate by intentional crimes (the CVLI), I would expect that at some point more violence (translated into more deaths by CVLI) does not increase the benefits from criminal activity and thus $H$ would saturate at some point $H_{\max}$.
The above equation is the mathematical formulation of what I just wrote, given the absence of police, crime first increases exponentially with a rate $\gamma$, slowing down until it eventually reaches a maximum of $H_{\max}$. Of course, fluctuations are expected, this model merely describes the tendency, not the point value at each month. The reader here may disagree with any of the thoughts I lay down here, the point is not that my reasoning is correct. Instead, I'm trying to lay down the most simple model for us to start thinking about this relationship more mechanistically.
Now we turn our attention to the police dynamics alone. Imagine that there is not crime. It vanishes suddenly! For sure, it wouldn't make sense to keep rising police actions. In fact, given the money spent on equipament, salaries and other stuff, if crime was non-existent governments would most likely diverge money to other resources, leading police actions to a decrease over time until it reaches 0 if criminal absence persisted. We thus write $P(t)$ as representing the frequency of police actions per month $t$ and assume that the baseline dynamics is characterized by
a exponential decay that keeps on and on, going eventually to 0. We can now think of the interaction between two things and the dynamics of it! First of all, I assume that police action is motivated through, primarily, violent crime levels. The main path through which police forces acquire knowledge of deaths by violent crimes is through reports $R(t)$, which are a fraction of true death rates $H(t)$ ($R(t) = p_R H(t) \, , 0 \leq p_R \leq 1$) and inteligence/investigations. The later takes some time $\theta$ to reveal a proportion $p_I$ of the real death rates. Thus the contribution from inteligence takes the form $p_I H(t)/\theta$. Finally, police action works as a response to criminal activity with some delay $\tau$, associated to the issue of mandates, planning and resource allocation. With all of this information, police action in the region increases on a rate $\beta$. Taking all of that into account, I consider that the police action dynamics takes the complete form
Time-varying parameters
Three scenarios
6. Discussion
References
- Tavoni, A., Dannenberg, A., Kallis, G., & Löschel, A. (2011). Inequality, communication, and the avoidance of disastrous climate change in a public goods game. Proceedings of the National Academy of Sciences, 108(29), 11825-11829.
- Ostrom, E. (2000). Collective action and the evolution of social norms. Journal of economic perspectives, 14(3), 137-158.
Data sources
| Source | Data | Access |
|---|---|---|
| Instituto Fogo Cruzado | Georeferenced shooting incidents with victim counts, 2022–2024 | api.fogocruzado.org.br |
| ISP-RJ | Monthly CVLI, robbery, and police action statistics by CISP/AISP, 2003–2025 | ispdados.rj.gov.br |
| IBGE Censo Demográfico 2022 | Population by neighborhood; FCU shapefile | censo2022.ibge.gov.br |
| SISPOL/PMERJ | AISP and CISP boundary shapefiles (July 2024) | Via ISP-RJ |
| geobr | Rio de Janeiro municipality and state geometries | github.com/ipeaGIT/geobr |